Follow us
facebook
instagram
x
youtube
tiktok
pinterest
threads
Latest News
Bitcoin Approaches $119K as Ethereum Hits Multi-Year High
August 11, 2025
Stablecoins Driving a New Era in Startup Funding
August 11, 2025
Lahore’s WAPDA House Shines for Independence Day
August 11, 2025
Transparent. Unbiased. Yours.
Toggle sidebar & navigation
Home
Breaking News
Economics
Politics & Government
Crime
General News
More
Human Rights
Defence & Security
Crypto
Finance
Real Estate
Home
Breaking News
Economics
Politics & Government
Crime
General News
More
Human Rights
Defence & Security
Crypto
Finance
Real Estate
Breaking News
Zelenskyy Rejects Trump’s Ukraine Land Swap Proposal
August 10, 2025
Man Harasses Teen on Manchester Bus, Confronted by Mother
August 10, 2025
US Tariffs Target Indian Oil Trade with Russia in Bid to Cut Kremlin Revenues
August 10, 2025
UK and US F-35Bs Conduct First Joint Operations from Japanese Carrier JS Kaga
August 10, 2025
London March to Demand Release of Hostages Held by Hamas
August 10, 2025
Instagram’s Real-Time Location Feature Raises Privacy Concerns
August 9, 2025
Mediators Urge Hamas and Israel to Resume Gaza Talks to Prevent Escalation
August 9, 2025
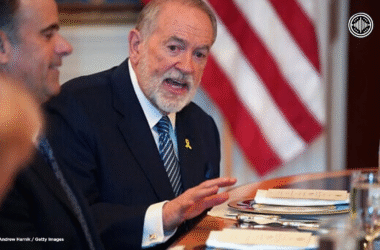
Mike Huckabee Criticises UK PM Starmer Over Israel Comments
August 9, 2025
India Supports Armenia–Azerbaijan Peace Treaty Signed in Washington
August 9, 2025
Iran Vows to Halt U.S.-Backed Caucasus Corridor, Citing Security Threats
August 9, 2025